Battery inspection · Application note
X-Ray Sources for Battery Cell Inspection
- Published 13 October 2026
- 15 min read
- Curpow application engineering
Short answer
Battery cell inspection needs a focal spot of 5 to 7 µm: better than 100 µm to separate adjacent electrode layers, and about 20 µm to measure where an electrode edge sits. The CX40 reaches 4.5 µm, the CX20 5 µm, and the CX30 7 µm at 4 W.
On this page
- What X-ray inspection finds inside a battery cell
- Pouch, prismatic and cylindrical cells: What changes for inspection?
- In-line inspection vs lab CT for battery cells
- What resolution a battery cell line needs
- Focal spot size at your operating power
- Tube voltage and contrast through the cell case
- Spot position stability, and why it matters for CT
- Choosing between the CX20, CX30 and CX40 for battery cell inspection
- Lead time, second sourcing and certification
- How to specify an X-ray source for a battery cell line
- What this means for your source selection
- Sources
The last step of the battery cell manufacturing process is sealing. A sealed cell cannot be cut open without destroying the structure inside. So cell manufacturers use an X-ray machine to see inside the cell and confirm the electrodes are placed correctly.
Researchers have already measured what cell inspection needs: the voltage to get through a cell, the resolution to separate electrode layers, and the scan time each method costs. We took those numbers from five published studies, including work by TU Braunschweig with PowerCo, and checked the CX20, CX30 and CX40 against every one of them. So you can read the requirements and our specifications in the same place.
Cell manufacturers use X-ray to verify anode and cathode overhang, find metal particles in the stack, check tab welds and confirm that electrolyte reached the layers. Four things decide whether an X-ray source is appropriate for accurate imaging on your production line. Focal spot size at the power you actually run. Enough kV to get through the case. Contrast at the buried layers. Spot position stability, if you are reconstructing. This page works through each one.
Key takeaways
- X-ray checks that the electrodes inside a sealed cell sit where they should. A cathode edge left uncovered drives dendrite growth, and nothing else sees inside a finished cell. The same scan also finds metal particles, bad tab welds, bent electrodes and dry spots the electrolyte never reached.
- Pouch, prismatic and cylindrical cells each need a different source setup. Cylindrical cells are wound and small, so the beam path is short. Pouch cells stack flat and can run 60 layers deep. Manufacturers build prismatic cells either way, so check which before you specify.
- Run 2D radiography on the line and CT in the lab. One radiographic exposure takes under 0.2 s, fast enough to check every cell. A CT scan of one 62-layer pouch stack took 1,900 projections and about an hour of scan time, which suits qualification and failure analysis.
- Match resolution to the feature you are measuring. You need better than 100 µm to tell adjacent electrode layers apart, and about 20 µm to measure where an electrode edge sits. The separator never appears at all, because it absorbs too little.
- Ask for the focal spot at the power you will actually run. The CX30 spot measures 8 µm at 4 W and 60 µm at 40 W. More flux costs you resolution, so pick the operating point your cycle time allows.
- The CX20, CX30 and CX40 each suit a different part of this work. The CX20 runs to 110 kV and names EV cell inspection on its data sheet. The CX30 reaches 130 kV and handles in-line work and CT. The CX40 has the smallest spot at 4.5 µm.
What X-ray inspection finds inside a battery cell
A finished cell is sealed, and cutting one open destroys it. So cell manufacturers use X-ray to see inside instead. It finds five kinds of defects:
- Electrode alignment and overhang. Manufacturers make the anode wider than the cathode all the way around, so it always covers the cathode edge. If the stack shifts and a cathode edge ends up proud of the anode, the current density goes uneven at that edge and dendrite growth follows. This is the safety-relevant one, and it is the reason cell manufacturers put X-ray on the line.
- Metal particles in the stack. An analysis of commercial 53 Ah pouch cells found metallic particles up to 1 mm by 1.7 mm between the layers, and concluded that cell manufacturers should expect particle contamination rather than treat it as an anomaly. CT work on other commercial cells picked up bright inclusions, likely copper, at higher grey-scale values than the surrounding jelly roll.
- Tab and current collector welds. That same CT work found welding burrs on a negative tab capable of puncturing the separator during cycling, plus tabs rolled onto the same side and overlapping each other.
- Deformation and coating faults. Also from CT: deflected anodes, jelly roll deformation, non-uniform cathode layers traced back to poor electrode coating, and separation of electrode layers in thermally abused cells.
- Electrolyte wetting and gas. Radiography can watch bubbles form and fluid spread as a cell fills. One test tracked it inside a pouch stack at 10 second intervals, at chamber pressures from 200 to 800 mbar. Gas from formation shows up the same way.
| Feature | Reported dimension | What was measured, and when | What it does not show |
|---|---|---|---|
| Anode overhang | Almost none to ~1.3 mm | 5 commercial LFP cells, 18650 and 26650, micrometre teardown, 2025 | Not a tolerance specification; cylindrical only, one chemistry |
| Can wall thickness | 0.246 to 0.313 mm, mean 0.28 mm | Same 5 cells | Says nothing about pouch or prismatic housings |
| Metallic particles found in cells | Up to 1 mm × 1.7 mm | 6 cells, 53 Ah NMC/graphite pouch, one manufacturer | No prevalence rate; one format, one supplier |
| Separator thickness | ~20 to 25 µm | Cited from literature | Not imageable by X-ray at any resolution, see below |
| Electrode layer thickness | ~100 µm | Cells examined by CT in 2018 | Not a specification, an observation on those cells |
Overhang and can wall from Wätzold et al. 2025; particles and separator thickness from Grabow et al. 2023; electrode layer thickness, welds and deformation from Wu et al. 2018; electrolyte filling from Masuch et al. 2023. Full references at the foot of the page.
Pouch, prismatic and cylindrical cells: What changes for inspection?
The format decides two things that matter to a source: how much material the beam has to cross, and how the layers overlap in the image.
| Format | Construction | Case | What that means for the source |
|---|---|---|---|
| Cylindrical | Electrode webs wound with separators into a jelly roll | Rigid steel or aluminium. Measured 0.246 to 0.313 mm on commercial 18650 and 26650 cells | Short path and a small object. Curvature means the wall thickness the beam crosses changes across the image, and wound layers overlap heavily near the core |
| Prismatic | Either a flat jelly roll or a stacked assembly | Rigid aluminium or stainless steel | Longest path across the wide face. Because the construction can be either wound or stacked, you cannot assume the layer geometry from the format alone |
| Pouch | Stacked only | Multilayer aluminium composite foil | Thin case, so penetration is easier. But large-format stacks are deep. The published test object had 62 separators with 31 anodes and 30 cathodes in about 10 mm, and the edges buried deepest in that stack are the hardest to see |
Construction and casing per Mekdour et al., Batteries, 2025, a review of cell form factors.
In-line inspection vs lab CT for battery cells
Radiography takes one exposure. On a 62-layer pouch cell stack, that exposure ran under 0.2 s. Fast enough to check every cell coming off the line. But a single image shows all 62 layers on top of each other. You can see that an electrode edge is out of place. You cannot tell which layer it belongs to.
CT of that same stack took about an hour of scan time: 1,900 projections at 180 kV and 11 µA, for a 20 µm voxel. A separate CT study of finished 18650 cylindrical cells and pouch cells reports about an hour of scan time per cell. Use CT for qualification and failure analysis, not for screening.
| Method | Reported result | What was measured, and when | What it does not show |
|---|---|---|---|
| 2D radiography | One exposure, under 0.2 s, at 128 to 130 kV; 5.08 µm per pixel in the vertical-beam setup | One stacked pouch composite, 62 separators, one laboratory, 2022 | Which layer in the stack moved; whether the stack is complete, from a single perpendicular image |
| Reference CT | 1,900 projections, about one hour of scan time, 180 kV at 11 µA, 20 µm voxel; ±50 µm accuracy on an edge-to-edge distance | Same composite | Anything at line rate. The paper states 3D techniques are of limited use for continuous in-line monitoring |
| CT of finished cells | About one hour of scan time per cell; resolution better than 100 µm needed to separate adjacent electrode layers | 18650 and pouch cells from consumer products | Separator position, which is invisible in CT; particles below separator pore size |
Radiography and reference CT from Masuch et al. 2023; finished-cell CT from Wu et al. 2018.
These numbers describe different acquisition geometries on different objects, so they do not add up to a single throughput figure.
What resolution a battery cell line needs
Battery cell inspection needs a focal spot of 5 to 7 µm. Three published measurements set that range. Electrode layers are about 100 µm thick, so you need better than 100 µm just to tell one layer from the next. Measuring where an edge sits took a 20 µm voxel on a 62-layer pouch stack. The separator never appears at all. It absorbs too little to show up.
Because X-ray cannot see the separator, an inspection station cannot claim the separator is intact. It can only tell you where the electrodes sit.
Focal spot size sets the floor under the first two, and most buyers ask about it first for good reason. The spot is an area rather than a point, so every projection carries some blur. At the detector that blur is the focal spot size multiplied by (M − 1), where M is the geometric magnification. Referred back to the object, where the electrode edge sits, it becomes F(1 − 1/M). That expression approaches the focal spot size and never exceeds it, so above about 5× magnification you are within 20 percent of F.
So the focal spot sets your resolution limit, and magnification decides whether the detector can see what the spot already resolved. A source in the 5 to 7 µm range clears both published requirements with room to spare. That is why cell inspection uses a microfocus source instead of a conventional tube.
One caveat on comparing numbers between suppliers. A focal spot figure is a measurement result, not a physical dimension. ASTM E2903-18 covers effective focal spots from 5 to 300 µm at up to 225 kV, measured by radiographs of edges. PTB’s NanoXSpot project, run under the European metrology programme precisely because this gap exists, states that manufacturers use proprietary measurement methods that give inconsistent results. Ask which method produced the number.
Focal spot size at your operating power
Tube power drives focal spot size. The spot is where the beam current lands on the target, and the target has a thermal limit. More power has to spread over more area. That means a data sheet quoting a minimum focal spot and a maximum power output is quoting two numbers that do not occur together.
Curpow publishes the full relationship on the CX30 rather than a single best-case figure, which is the only way to answer the question an integrator has: what is the spot at the power my line needs?
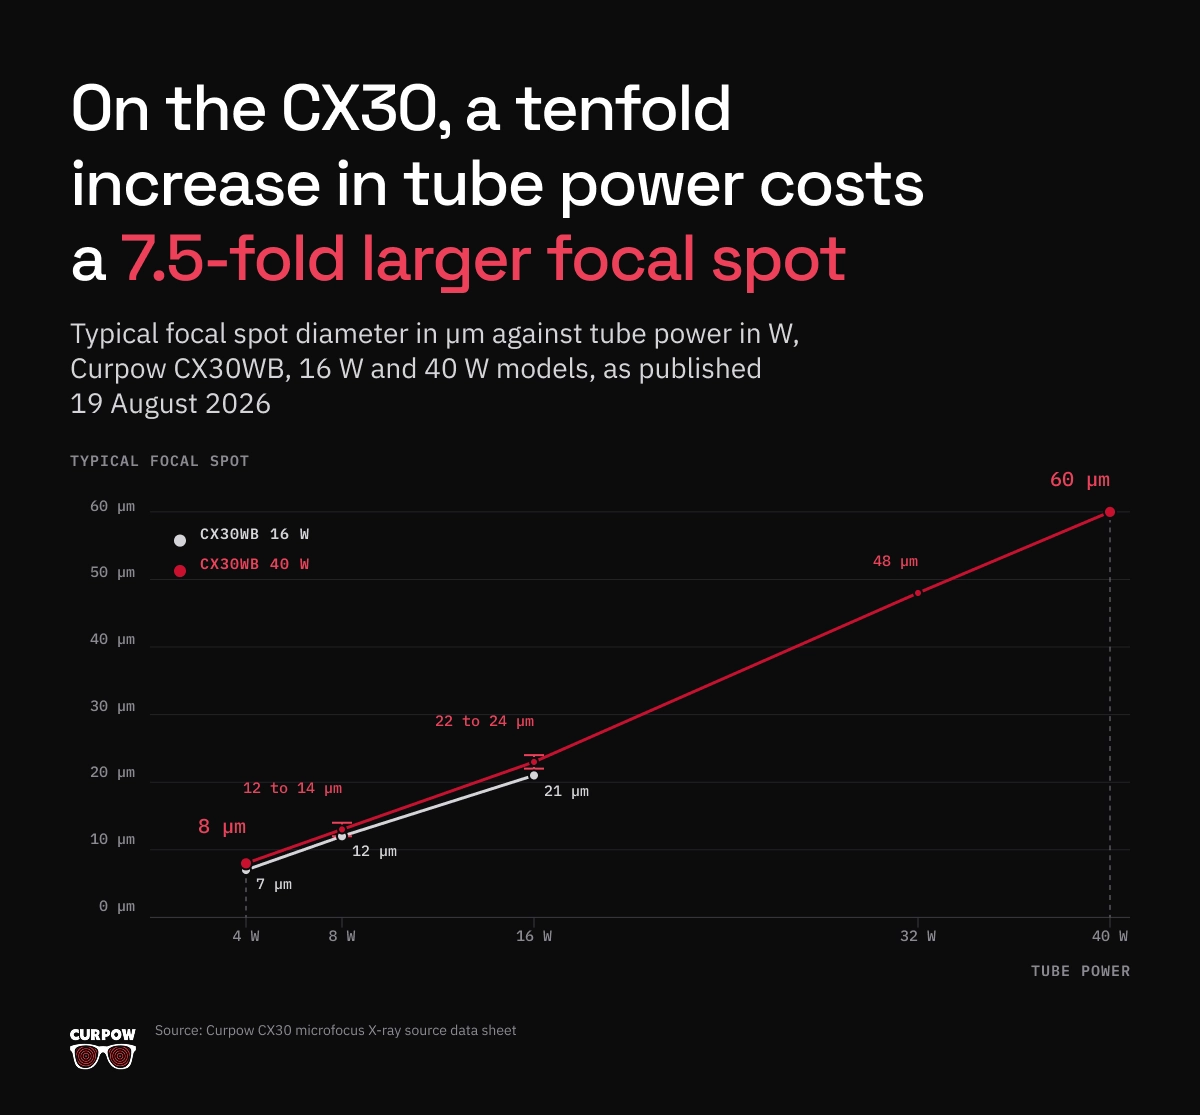
Read down the 40 W column and the shape of the trade is clear. Power rises ten times, from 4 W to 40 W. Spot diameter rises 7.5 times, from 8 µm to 60 µm. Because spot area goes as the square of diameter, the area grows about 56 times, so power per unit area at the target drops to roughly 18 percent of its 4 W value.
At 4 W you get 7 to 8 µm, well inside the 20 µm voxel that overhang measurement needs. At 40 W you have given that up for speed. Both are valid operating points. Work out which one your cycle time allows before you specify the source, not after.
When the line needs the smallest spot rather than the most flux, the CX40 reaches 4.5 µm on the wide-beam variant.
Tube voltage and contrast through the cell case
Voltage depends on how much material the beam has to cross. That changes with the cell format, so there is no single voltage for battery inspection.
The radiography of a large stacked pouch composite, roughly 300 mm by 90 mm and 10 mm deep, ran at 128 to 130 kV. CT of the same object ran at 180 to 200 kV. A cylindrical cell through a quarter-millimetre steel can is a far shorter path and needs less.
Contrast catches people out. Raising kV improves penetration. It also flattens the attenuation difference between an electrode and its coating. On a deep stack those two pull against each other.
Shooting straight down through a 62-layer pouch cell stack, only 20 of the 31 anode edges came out clearly enough to separate. The cathode edges deeper in the stack came out worse. Low contrast caused it, not spot size. So penetration alone does not buy you a measurement of every layer in a deep stack. Check a source for contrast at the buried layers, not just kV at the case.
Beam geometry matters here too. The CX30 puts out a 115 degree wide round beam with a uniform profile. That suits automated inspection and off-angle views, and its 10 mm spot-to-window spacing gives high geometric magnification. Off-angle views are how you get depth information out of a 2D system without going to full CT.
Spot position stability, and why it matters for CT
If you are reconstructing rather than screening, spot position stability belongs in the specification next to spot size. Drift during a scan smears every projection that follows, and a stable 8 µm spot will out-reconstruct an unstable 5 µm one every time.
The CX30 data sheet lists a highly stable spot position for CT and 3D, and a high reliability design for in-line applications. The CX20 sheet lists high flux and spot location stability, for consistent imaging with minimal variation over time. Both also carry automatic source conditioning, which ramps the source up slowly after it has been off, and a digital interface exposing diagnostics and operating logs. On a production line the logs are what let you tie an image quality drift back to the source rather than to the process.
Choosing between the CX20, CX30 and CX40 for battery cell inspection
All three are low powered and high kV by design, which is the right trade for edge and layer work.
| CX20 | CX30 | CX40 | |
|---|---|---|---|
| Maximum tube voltage | 110 kV | 130 kV | 90 kV, 80 kV side-window |
| Minimum focal spot | 5 µm narrow beam, 7 µm wide beam | 7 µm at 4 W, see FIGURE 1 for the full curve | 4.5 µm wide beam, 5 µm narrow, 15 µm side-window |
| Maximum power | 25 W | 16 W or 40 W model | 8 W |
| Beam angle | 90° narrow, 125° wide | 115° round, uniform profile | 108° wide, 40° narrow, 34° side-window |
| Focus to object distance | 7.5 ± 1.0 mm | 10 ± 0.5 mm spot to window | 6.0 mm wide beam |
| Target and window | Tungsten (W) target, beryllium (Be) window | W target, Be window 0.51 mm | W target, Be window |
| Weight | 5.7 kg | 8.6 kg | 3.6 kg |
Specs from the CX20, CX30 and CX40 data sheets. The short focus-to-object distances are the numbers worth noticing for cell work, because getting the cell close to the spot is what makes magnification available at all, and the CX40 at 6.0 mm is the shortest in the range.
Curpow’s own target application list names in-line battery inspection for alignment detection, alongside microfocus inspection of batteries, mini LEDs and PCBs.
Lead time, second sourcing and certification
Curpow designs and manufactures microfocus X-ray sources, high voltage low power X-ray modules and stand-alone X-ray power supplies. Those go inside equipment that inspection OEMs and integrators build. Curpow also builds application-specific turnkey systems.
Lead time is six weeks. On a line qualification schedule that is often the specification that matters most. Buyers fund second-source qualification for that reason, rather than deferring it.
How to specify an X-ray source for a battery cell line
- Name the measurand, not the part. You can specify against “anode to cathode edge distance on a stacked pouch cell, in the plane of the stack”. You cannot specify against “inspect the cell”.
- Start from the format. Wound, stacked, or either. That sets the attenuation path and the layer geometry before any spec follows.
- Set the resolution from the feature. Better than 100 µm separates adjacent layers. Around 20 µm voxel measures where an edge sits. Do not specify past what the measurement needs.
- Budget measurement uncertainty against the tolerance. The published radiography to CT agreement on electrode position was ±65 µm, being ±50 µm on the CT reference plus ±15 µm on the radiographic coordinate measurement. Against a ±150 µm overhang tolerance, measurement has taken 43 percent of the band before you judge a single cell.
- Ask for focal spot at your operating power, and ask which standard measured it. If nobody can give you a spot against power curve, you do not yet know what the source does in your duty cycle.
- Check contrast at the buried layers, not just kV at the case. This is where deep-stack work fails, and it fails quietly, because a brighter image with less contrast still looks like a better image.
- If you are reconstructing, specify spot position stability separately from spot size.
What this means for your source selection
Cell manufacturers put X-ray on the line for one main reason. Electrode alignment affects safety, it sits sealed inside the cell, and nothing else checks it on the finished product. The particles, the welds and the wetting all come free with the same station.
If you are working through it now for a cell line, send us the measurand, the cell format and the cycle time, and we will tell you which of the three fits and at what operating point. Talk to Curpow engineering. Browse our other applications on the applications hub.
Sources
“Applications and Development of X-ray Inspection Techniques in Battery Cell Production”. Steffen Masuch, Philip Gümbel, Nicolaj Kaden and Klaus Dröder, Institute of Machine Tools and Production Technology, TU Braunschweig, with PowerCo SE and Battery LabFactory Braunschweig; Processes 11(1):10, 21 December 2022; peer-reviewed review with the authors’ own experimental work; full text. Experimental results come from a single stacked pouch electrode-separator composite in one laboratory, and the paper publishes no numeric overhang tolerance.
“Analysis of Manufacturing-Induced Defects and Structural Deformations in Lithium-Ion Batteries Using Computed Tomography”. Yi Wu, Saurabh Saxena, Yinjiao Xing, Youren Wang, Chao Li, Winco K. C. Yung and Michael Pecht, Nanjing University of Aeronautics and Astronautics, CALCE at the University of Maryland, Chongqing Technology and Business University and Hong Kong Polytechnic University; Energies 11(4):925, 2018; peer-reviewed CT study; full text. Cells were 18650 and pouch cells taken from consumer products rather than production line samples, and the paper reports no defect dimensions in micrometres.
“Design Analysis of 26650 and 18650 LFP Cells for High Power and Low Temperature Use Cases”. Fabian Wätzold, Anton Schlösser, Marius Leistikow and Julia Kowal; Batteries 11(1):38, 2025; peer-reviewed teardown study; full text. Five commercial cells, one chemistry, cylindrical formats only. The authors measured dimensions with a micrometre during disassembly rather than by X-ray, and they describe individual cells rather than manufacturer tolerances.
“Particle Contamination in Commercial Lithium-Ion Cells: Risk Assessment with Focus on Internal Short Circuits and Replication by Currently Discussed Trigger Methods”. Jonas Grabow, Jan Klink, Ralf Benger, Ines Hauer and Hans-Peter Beck; Batteries 9(1):9, 2023; peer-reviewed study; full text. Six 53 Ah NMC/graphite pouch cells from one manufacturer, examined at low state of charge.
“Comparative Analysis of Cell Design: Form Factor and Electrode Architectures in Advanced Lithium-Ion Batteries”. Khaled Mekdour, Anil Kumar Madikere Raghunatha Reddy, Jeremy I. G. Dawkins, Thiago M. Guimaraes Selva and Karim Zaghib, Department of Chemical and Materials Engineering, Concordia University; Batteries 11:450, 2025; peer-reviewed review; full text. A review of electrochemical and mechanical performance by geometry.
“Standard Test Method for Measurement of the Effective Focal Spot Size of Mini and Micro Focus X-ray Tubes”. ASTM E2903-18, ASTM International, 2018, reapproved 2024; consensus standard; cited for its published scope, which covers focal spot dimensions from 5 to 300 µm on systems up to and including 225 kV tube voltage by means of radiographs of edges, and draws on EN 12543-5. Focal spots larger than 300 µm fall under E1165 instead.
“18NRM07 NanoXSpot: Traceable measurement of focal spot size and shape”. Physikalisch-Technische Bundesanstalt, under the EMPIR programme co-financed by participating states and Horizon 2020; project record, 2019; national metrology institute project documentation.
“CX30 Microfocus X-Ray Source”, “CX20 Microfocus X-Ray Source” and “CX40 Microfocus X-Ray Source” data sheets, plus the Curpow company page. Curpow Inc.; manufacturer specifications, typical values; CX30 sheet dated 19 August 2026.
FAQ
Direct answers
Frequently asked questions about X-Ray sources for Battery Cell Inspection
What defects does X-ray inspection find in a battery cell?
Electrode alignment and anode to cathode overhang, metal particles between the layers, tab and current collector weld faults, electrode deformation and coating non-uniformity, and electrolyte wetting or gas pockets. Published CT work on commercial cells found welding burrs on a negative tab capable of puncturing the separator, deflected anodes, and metallic inclusions up to 1 mm by 1.7 mm.
What resolution do you need for battery cell X-ray inspection?
Better than 100 µm to tell adjacent electrode layers apart, because the layers themselves are around 100 µm. About 20 µm voxel to measure where an electrode edge sits, which is what overhang verification needs. A microfocus source with a 5 to 7 µm focal spot clears both with margin.
Can X-ray inspection see the separator in a lithium-ion cell?
No. The separator’s attenuation is too low, so it does not appear in the image at any resolution. X-ray confirms where the electrodes are and says nothing directly about the barrier between them. That boundary matters when writing an inspection specification, because a station cannot claim separator integrity from an X-ray image.
What tube voltage does battery cell X-ray inspection need?
It depends on the attenuation path, not on the application name. Published radiography of a large stacked pouch composite ran at 128 to 130 kV, and CT of the same object at 180 to 200 kV. A cylindrical cell through a 0.28 mm steel can is a much shorter path. Derive it from your thickest orientation, then check the contrast that voltage leaves you at the buried layers.
Why does focal spot size change with tube power?
The spot is where the beam current lands on the target, and the target has a thermal limit, so more power spreads over more area. The CX30WB 40 W data sheet shows it directly: a typical spot of 8 µm at 4 W becomes 60 µm at 40 W. Ten times the power, 7.5 times the diameter, 56 times the area. A single minimum focal spot figure says little about what a source does on your line.
Can in-line 2D X-ray replace CT for measuring electrode overhang?
Not for every electrode in a stack, on the published evidence. A single image shows all the layers on top of each other, so it gives edge positions without telling you which layer moved. A study of a 62-layer pouch cell stack concluded that only a time-intensive CT can measure electrode position at high resolution, and that qualitative visual X-ray inspection is not sufficient for a safety-relevant feature. Radiography screens every cell in under 0.2 s; CT adjudicates and qualifies.
Which Curpow source suits battery cell inspection?
The CX20 data sheet names EV cell inspection and small lithium cell inspection as primary applications, at 110 kV and 25 W with a 5 µm minimum spot. The CX30 reaches 130 kV and publishes a full spot against power curve, with a 115 degree beam suited to automated inspection and off-angle views. The CX40 has the smallest spot in the range at 4.5 µm and the shortest focus to object distance at 6.0 mm.